


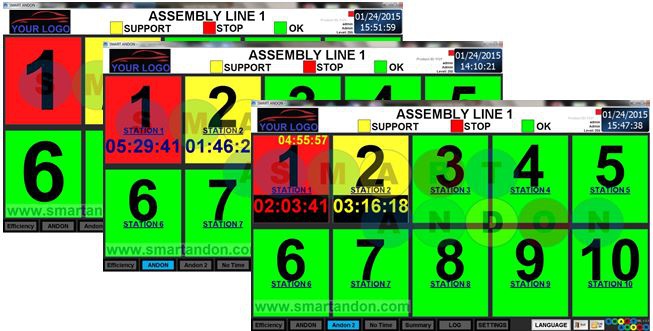
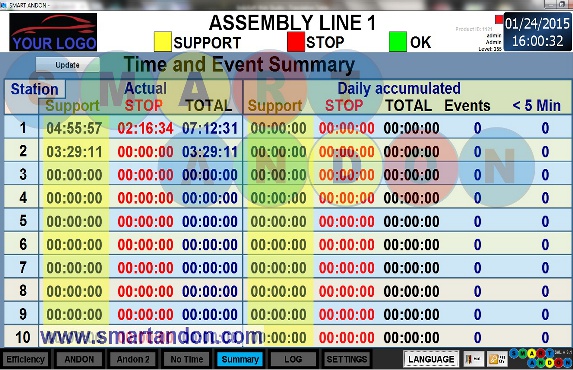
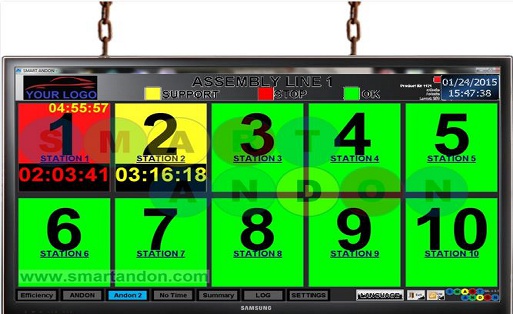


• This is the "Home" screen, where you can see all the stations and their current status. Each Smart Andon
Service Request has 10 available stations, and each station has 3 different states that will be activated with
the wireless button directly on the station. This is also what is going to be displayed on the large screen
(without the taskbar on the bottom).
• The green state indicates that the station is currently working.
• The yellow state indicates that support was requested and it starts a timer since the button was pressed until the next time the operator presses the button.
• The red state indicates that the station is currently stopped, it also sets a timer and it starts when the operator presses the button for the second time. In this screen you can also see the time that the station spent on the "Stop" Status in the yellow numbers over the station number.To return to the green screen you only have to press the wireless button again.
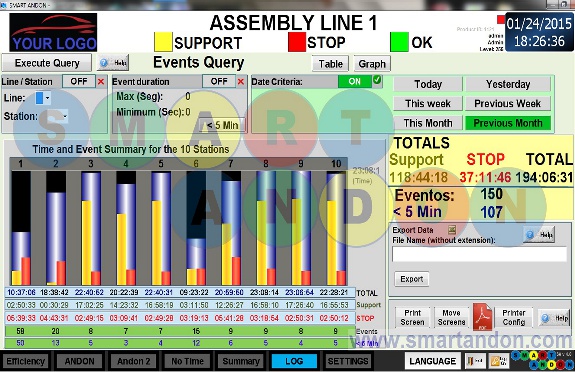
• The system is able to display the events recorded in each station in two types of graphs and tables, this is
the first type of graph, which includes the time that the station stopped (blue and white) and the total of
events that ocurred in the station (green). Also on the right side you can see the time spent on support
status, the time spent on stop status and the total time. The short (events that lasted less than 5 minutes)
are also displayed on this part.
• This information is flexible to what the administrator requests, as you can see, on the top of the screen you can select the parameters for the query.
• This information is flexible to what the administrator requests, as you can see, on the top of the screen you can select the parameters for the query.
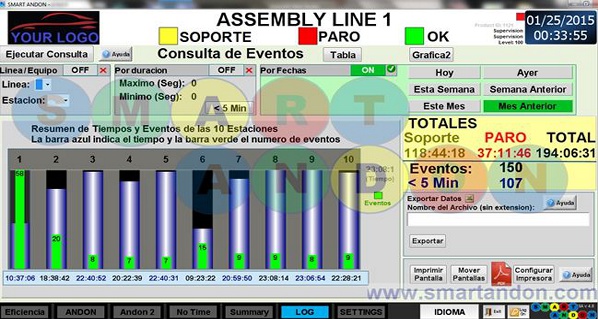
• This is the second type of graph available, the blue and white bar displays the total events per station,
the yellow bar displays the support time spent on the station, and the red bar displays the stop time spent
on the station. Below the graph you can see also see the data of each station displayed. All the other
functions keep working the same way
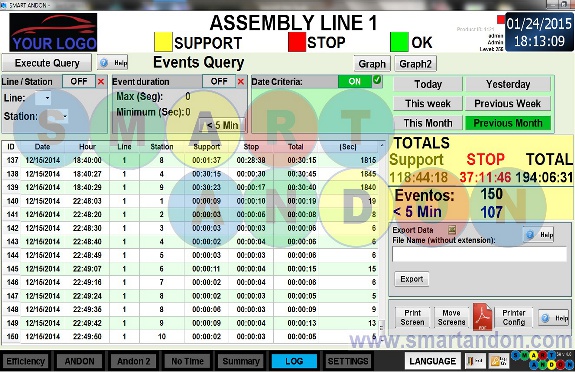
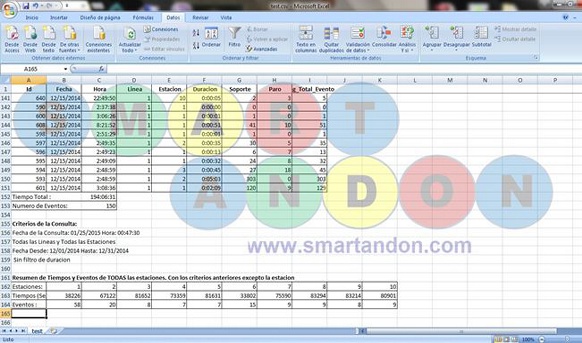
• As mentioned before, the third way to display the recorded information is by tables, here, each event has
an own ID to be easy to identify. The date, hour, line, station, support time, stop time, total time and the
time in seconds is displayed aswell. The other functions keep working the same way.
• The two types of graphs and the table log can be exported to a Microsoft Excel document simply by
pressing the button "Export" on the right side of the screen. You can set the name that you prefer for the
document aswell as the location of it. The table and graphs can also be exported to a PDF document and be
printed directly from the sytem.
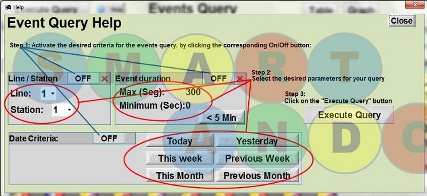
• The help button (next to execute query on the left top side) opens a helpful image explaining how to
select the desired parameters for the query.
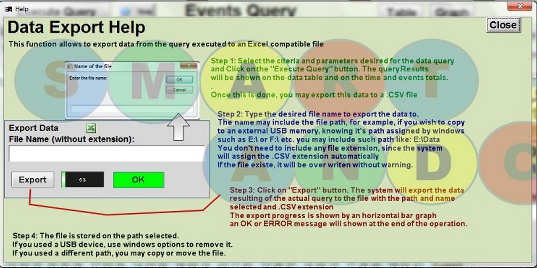
• The help button on the middle right side opens a helpful image explaining how to export the table log
or graphs to a Microsoft Excel document.
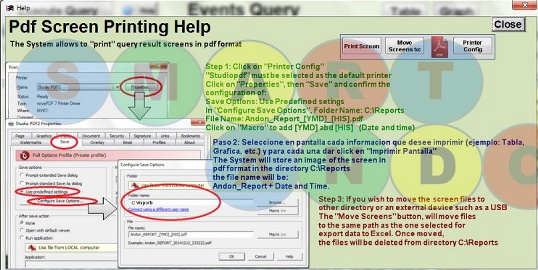
• In case of needed, a third Help button is displayed next to the PDF printing options, this one will open a
step-by-step guide of how to export the data to a PDF document and/or print directly from the system.
• Smart Andon Service Request has flexibility to adapt to what the administrators need. This image shows
the "Home" screen with each stations timer. This screen just shows the current status of each station, this
can be adjusted in the "Settings" button.
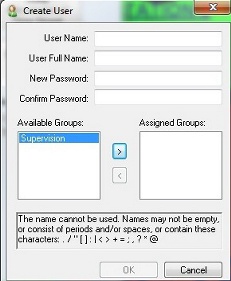
• The administrator of the system has the hierarchy to create new users and add them to certain groups
according to what they will be able to do.
• This is picture shows the taskbar for the system's administrator.
• This other picture shows the taskbar for the system's operators. As you can see, an operator can only
access to certain screens and will have limited funcionality.
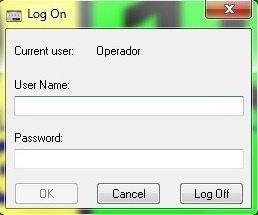
• Each time the system starts, it will ask for a username and a password.
Visual Event Indication
Times and Events summary
• Actual events and daily accumulated.
• Support, stop, total times and number of events
Historical Data Query
Export Data to Excel
Help Screens
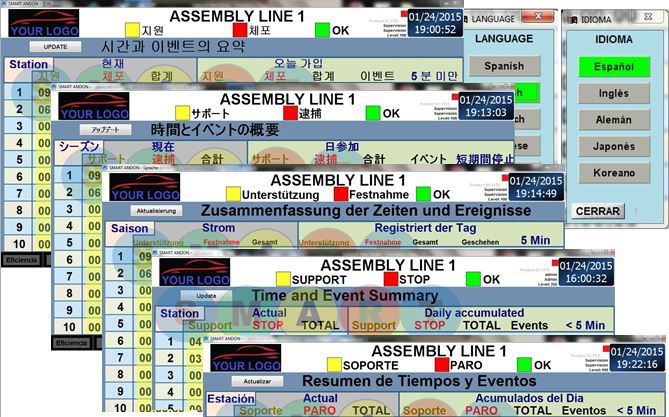
Multi-Language Systems
• Each Smart Andon system and all of its functionalities are available in 5 languages: English, Spanish,
German, Japanese and Korean.
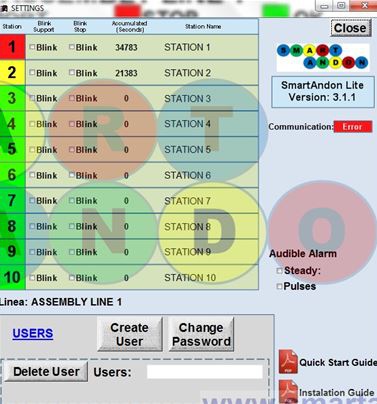
Flexible
Adjustable
• Line names.
• Station names.
• Indication mode (blinking).
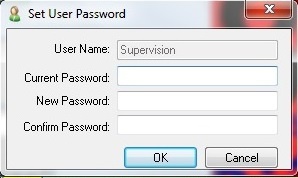
• Users and passwords.
• Audible alarm.
• Guide PDFs for easy installation.
• Station names.
• Indication mode (blinking).
• Users and passwords.
• Audible alarm.
• Guide PDFs for easy installation.
Users and Passwords