


Benefits
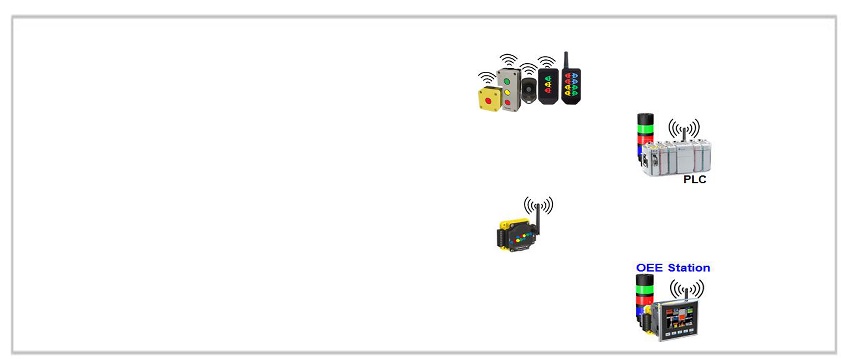
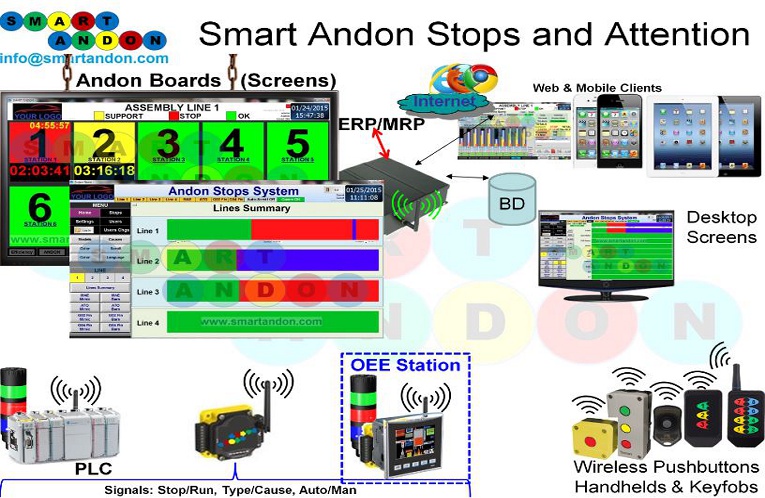
Expansion options
Data acquisition options
• Wireless buttons
• PLCs
• Radios
• OEE Station
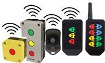
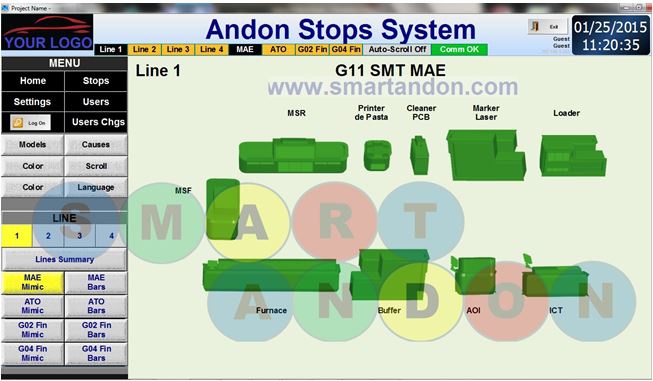
Visual Event Indication
• Customizable screen size.
• Posibility of multiple screens
• Posibility of multiple screens
Bar graphs for line status,
machine status and station status
• Green: Line/Machine/Stations working normally.
• Red: Stop.
• Blue: Line/Machine/Stations receiving attention.
• Red: Stop.
• Blue: Line/Machine/Stations receiving attention.
Station's mimic
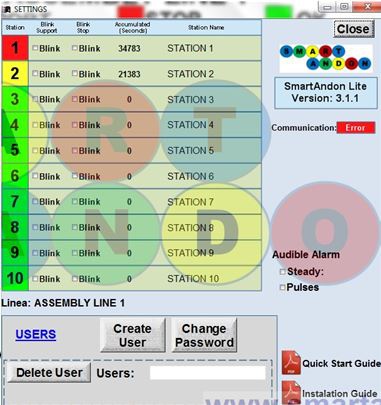
Settings
• Line's name.
• Station's name.
• Blinking indication(blink).
• Users and passwords.
• Audible alarm.
• PDF start guide and installation.
• Station's name.
• Blinking indication(blink).
• Users and passwords.
• Audible alarm.
• PDF start guide and installation.
• Lean Manufacturing strategy.
• Immediate problem notification.
• Quick answer for stops / problems.
• Down time reduction.
• Event and time recording.
• Graphics for information analysis.
• Historical Data Base.
• Immediate problem notification.
• Quick answer for stops / problems.
• Down time reduction.
• Event and time recording.
• Graphics for information analysis.
• Historical Data Base.
• Quick and easy installation.
• No wiring required.
• Easy operation and maintenance
• "Lite" and "Full" versions, according to the customers' needs.
• Adaptable system to specific customers' needs
• No wiring required.
• Easy operation and maintenance
• "Lite" and "Full" versions, according to the customers' needs.
• Adaptable system to specific customers' needs
• Web and mobile Access
• Event notification via email
• System can be integrated to ERPs/ MRPs and third party information systems.
• Event notification via email
• System can be integrated to ERPs/ MRPs and third party information systems.
• Integration options with our systems:
•Productivity
•OEE plant floor information system.
• Server-based architecture option for multiple machines
•Productivity
•OEE plant floor information system.
• Server-based architecture option for multiple machines
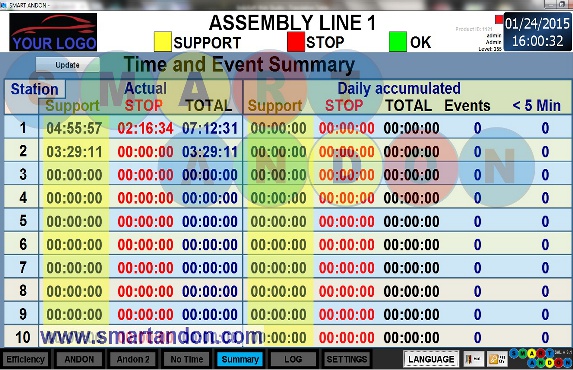
Times and Events summary
• Actual events and daily accumulated.
• Support times, stop times, total times and events.
• Support times, stop times, total times and events.
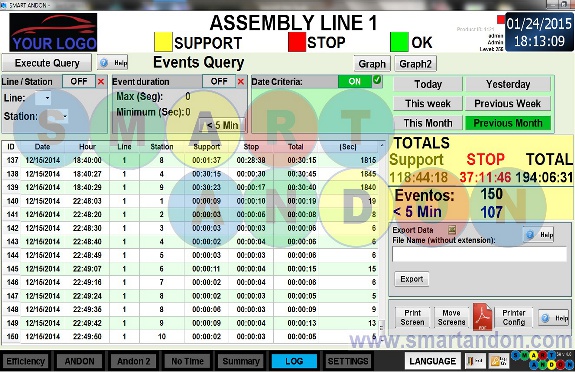
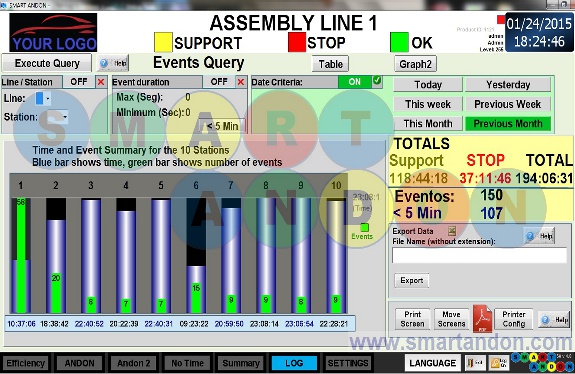
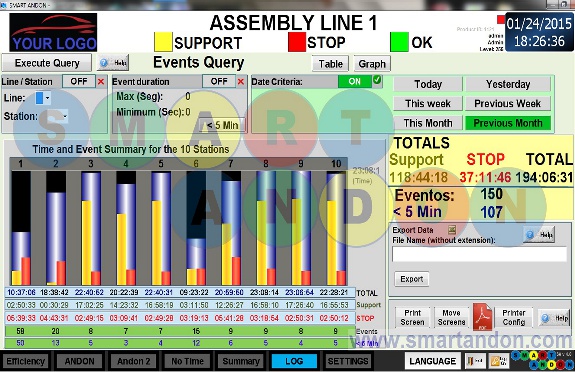
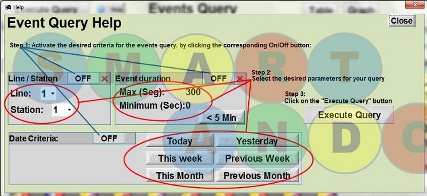
Historical data query
• Valuable information for analysis and decision making.
• Queries by date, duration and station.
• The results of the query are shown in tables and bar graphs.
• Time and Events totals.
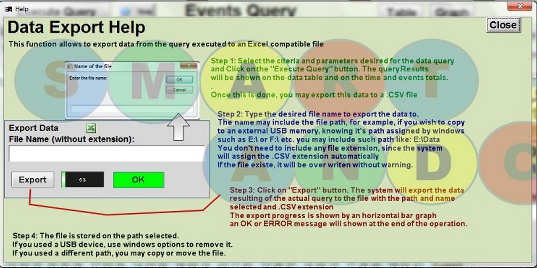
• Option to export data to Excel.
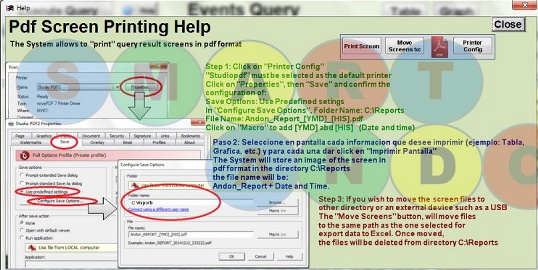
• Option to print screen in PDF.
• Help screens.
• Queries by date, duration and station.
• The results of the query are shown in tables and bar graphs.
• Time and Events totals.
• Option to export data to Excel.
• Option to print screen in PDF.
• Help screens.
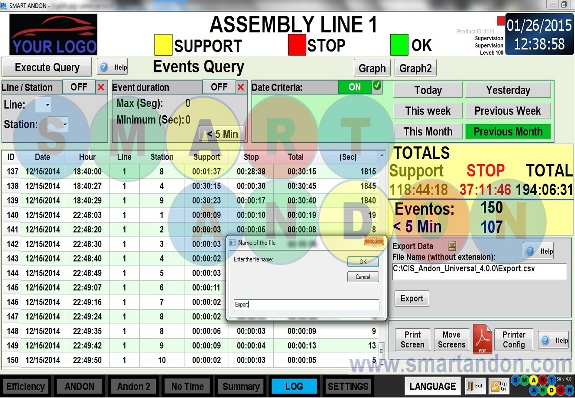
Historical data query
Export data to Excel
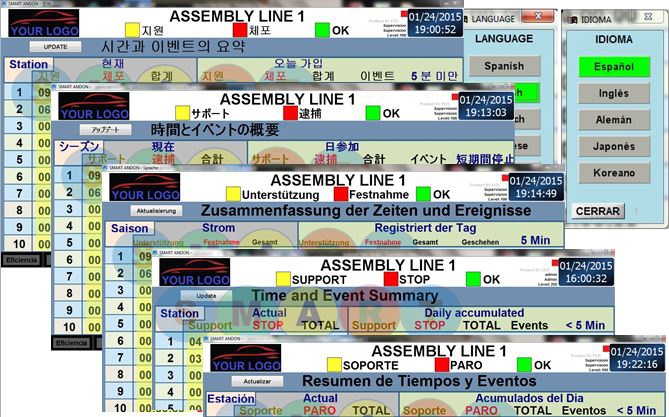
Languages
Help screens
• All the Smart Andon systems are multi-language (English, Spanish, German,
Korean and Japanese).
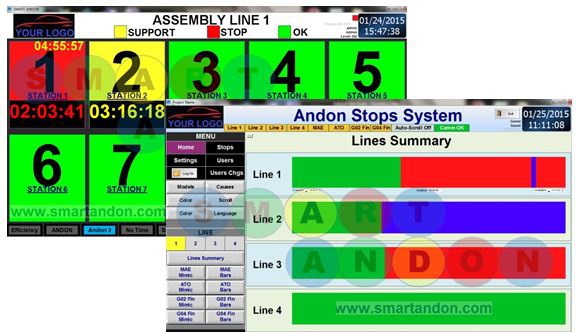
• This type of Andon logs the response and solution time for problems in each station or machine in a
production line or cell.
• Each station status is shown on horizontal bar graphs with colors: Green: OK, Red: Stop, Blue: Service in progress.
• The status of the stations is summarized on a bar graph for the production line or cell.
• The horizontal bar graphs allow a quick visualization of the stations behavior during the time period selected such as: Shift, Day, Week, Month, etc.
• This allows Management and supervision to quickly identify the stations or machines having problems and the duration of these problems and take the corrective actions to improve productivity of the production line or cell.
• Database, reports, graphs and analysis are also provided as in all our Smart systems to allow further information analysis.